We all know Excel is the powerful go-to application for most any data activity. Combine it with PowerBI to get even more comprehensive data analytics and visualizations. You can easily collect, shape, analyze and explore vital business data in exciting new ways—all in less time—using both of these apps together!
Get powerful new capabilities using the skills you already possess by simply transferring your current Excel queries, data models, and reports to Power BI. Create interactive dashboards—without having to learn a new application or language.
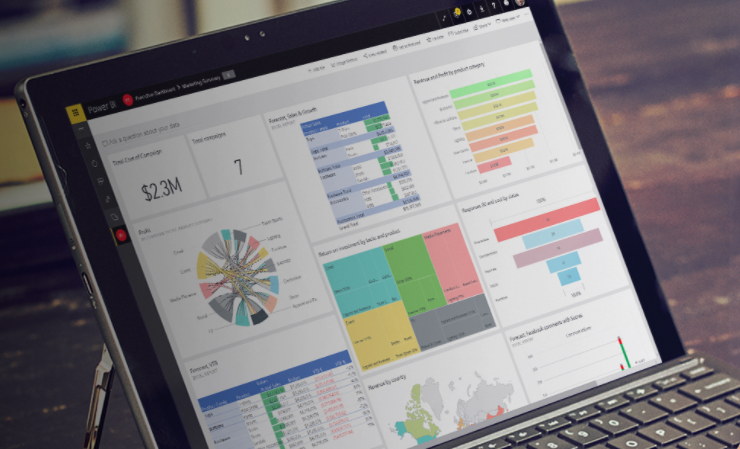
Use and share various Excel workbooks in a single view. Display columns and rows of data records, charts and graphs, and tables on a Power BI dashboard from multiple sources. With a single command, connect to your data models directly from Excel to create powerful pivot tables and visuals.
Automate your data refresh instantly. Get real-time data automatically when you open your dashboard—without having to take any additional action. Set your data to refresh manually or schedule at any frequency you choose.
Get self-service data visualization. Get interactive visualizations and the ability to query by extending your Excel data models to your Power BI reports. Empower colleagues of varying experience levels—even Excel novices—to understand your insights and discover their own.
Add advanced analytics to your models. Get enhanced custom visualization, modeling, and predictive capabilities for impressive analytics workflows in PowerBI by running R scripts (R is a language and environment for statistical computing and graphics) and using R-powered custom visuals.
Get started partnering Excel and Power BI in the following 3 steps:
- Download Power BI Desktop. Create interactive reports by connecting to your Excel data and using a drag-and-drop canvas with numerous innovative data visuals.
- Get a Power BI trial. Share and distribute data reports with other users using Power BI Pro. Get a 360-degree view of your business in one dashboard, including Excel reports and objects.
- Analyze Power BI data with Excel tools. Using the Analyze in Excel feature you can view and work with your Power BI datasets in Excel. Gain insights on your data using Excel tools like pivot tables, charts, and slicers—all within Power BI.